It is often said in popular literature that figures lie and liars figure. However, sometimes in science, the lie is by omission. What we don’t say can be even more important in our conclusions than what we do. Two charts illustrate this principle in a centrally important issue of U.S. clinical practice.
The first chart is compiled by Statista, a well-respected data services company known worldwide. It addresses the relative potency and incidence (the rate of occurrence in postmortem tox screens) of drugs that appear in U.S. accidental drug overdose deaths. Original sources for the data are the U.S. Centers for Disease Control, the National Institute on Drug Abuse, and the National Center for Biotechnology Information, a division of the United States National Library of Medicine, which is a branch of the National Institutes of Health (NIH).
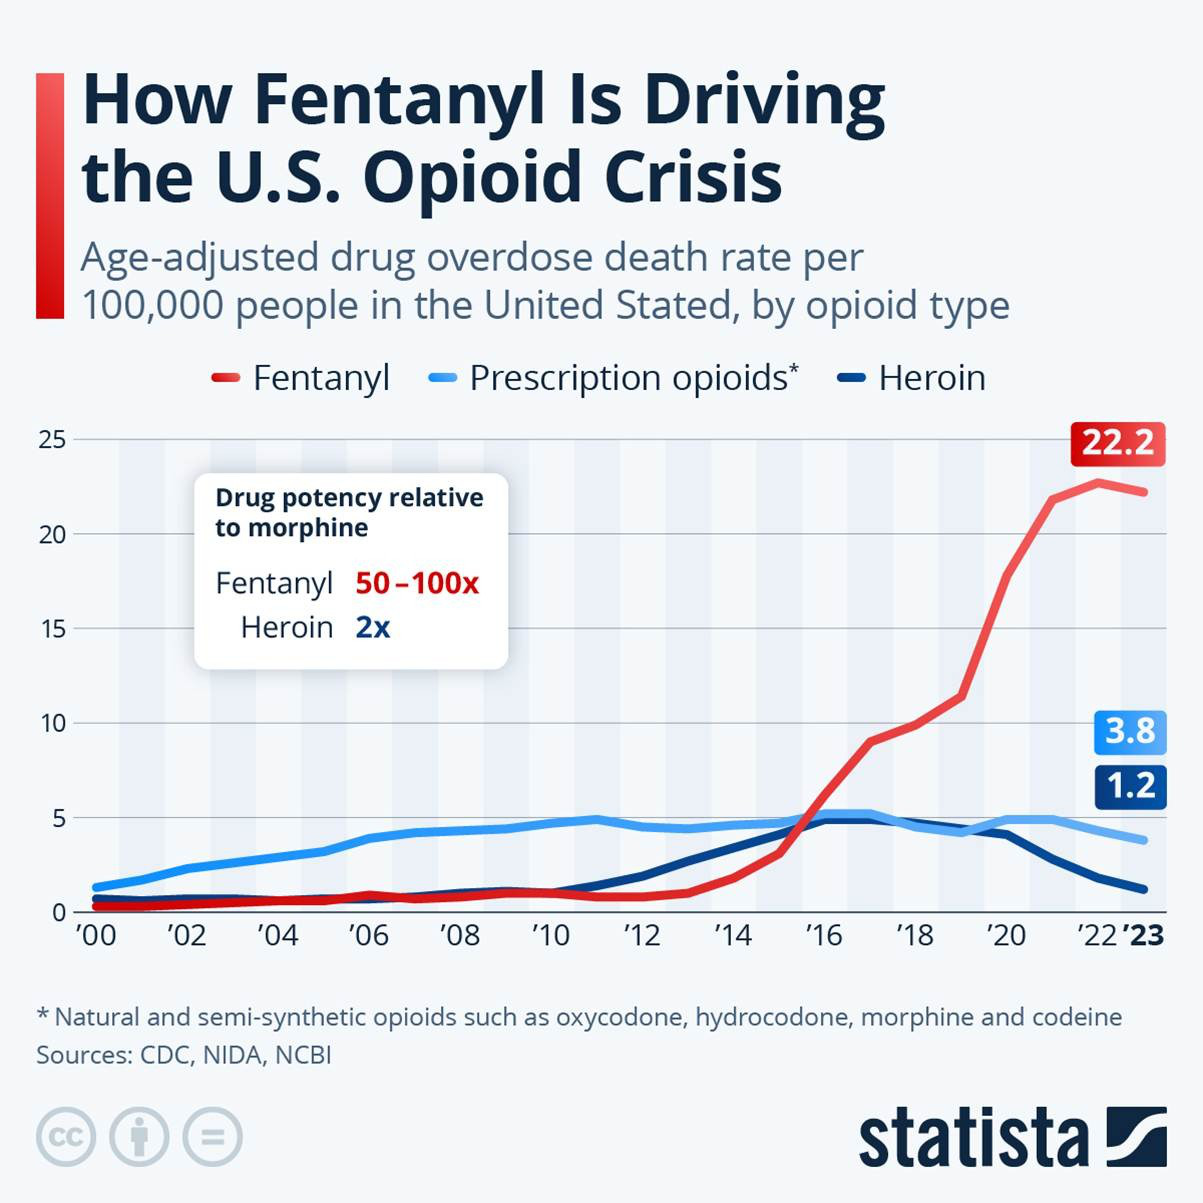
As far as the chart goes, it is accurate. But what is missing? First, no distinction is made between pharmaceutical fentanyl and illegally manufactured fentanyl. Second, unacknowledged in the original sources is that the rise in overdose deaths due to fentanyl following 2012 was arguably a direct result of U.S. public health and law enforcement agency policy.
Imposition of Prescription Drug Monitoring Programs in all 50 states effectively destroyed the business model of pill mills that formerly diverted pharmaceutical drugs into street markets. Drug cartels then adjusted to attacks against their couriers and mules by transitioning to more potent and concentrated forms of addictive opioids that now appear widely in counterfeit pain pills sold in street markets.
A second and quite different chart also tells us a great deal. This second chart shows us that since 2010, neither drug overdose deaths nor hospital admissions for opioid toxicity have been driven by prescriptions written by doctors for their patients in pain. Overdose deaths have skyrocketed even as restrictive policy on prescribing has driven prescribing ever downward, and ever more patients into agony and sometimes suicide.
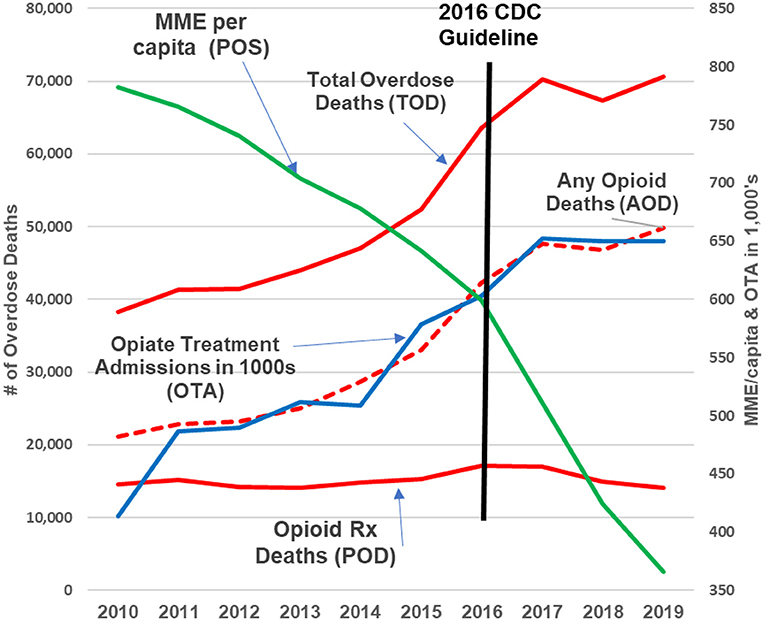
This second chart is not an opinion. It reflects published data. And it was used exactly as it appears above in the 2023 consensus guidelines from the American Society of Interventional Pain Physicians (ASIPP). See Comprehensive, Evidence-Based, Consensus Guidelines for Prescription of Opioids for Chronic Non-Cancer Pain.
There is a lesson here for all of us: The road to hell is indeed paved with intentions, good and bad. And U.S. health care agency policy takes the same path when it blames doctors for something they didn’t actually do. The U.S. opioid crisis was not caused by doctors prescribing opioids to desperate patients in severe pain. And it won’t be solved by denying pain relief to over 50 million U.S. citizens.
Richard A. Lawhern is a nationally recognized health care educator and patient advocate who has spent nearly three decades researching pain management and addiction policy. His extensive body of work, including over 300 published papers and interviews, reflects a deep critique of U.S. health care agencies and their approaches to chronic pain treatment. Now retired from formal academic and hospital affiliations, Richard continues to engage with professional and public audiences through platforms such as LinkedIn, Facebook, and his contributions to KevinMD. His advocacy extends to online communities like Protect People in Pain, where he works to elevate the voices of patients navigating restrictive opioid policies. Among his many publications is a guideline on opioid use for chronic non-cancer pain, reflecting his commitment to evidence-based reform in pain medicine.